“Degrees of Truth”
Getting Heat Treat Temperature Uniformity Surveys (TUS) Measurement Right, Every Time
Introduction
In the world of heat treatment, temperature measurement, whether performing process monitoring or temperature uniformity surveys, as part of AMS2750, measurement accuracy is critical. As stated in the definition “the degree to which the result of a measurement, calculation, or specification conforms to the correct value or a standard” without true confidence in accuracy you are working in the dark or deceiving yourself or possibly even others.
It has been very interesting to witness the level of debate and heated discussion over the requirement for 0.1 °F readability first referenced in the F revision of AMS2750 pyrometry standard. Although helpful in improving the resolution of reading this does not necessarily guarantee accuracy.
The following article introduces important considerations to be made when performing the temperature monitoring operation with reference to measurement accuracy in a real-world test environment, on a shop floor, not just a stable controlled calibration laboratory.
Monitoring & TUS Methodology
Traditionally Temperature Uniformity Surveys (TUS) are performed using a ‘field test’ instrument which in most situations will be a temperature data logger. For static batch ovens a static data logger is positioned externally to the furnace. Long thermocouples are trailed into the furnace heating chamber connected directly to the TUS frame. For continuous or semi-continuous modular processes, the trailing thermocouple method is difficult if not impossible. For such heat treat furnaces the preferred method of monitoring is by ‘Thru-Process’ temperature monitoring. The data logger travels through the furnace itself with the TUS frame. To protect the data logger from the hostile process conditions (including heat, pressure, steam, water, salt or oil) the data logger is encased in a thermal barrier designed for the process in hand.
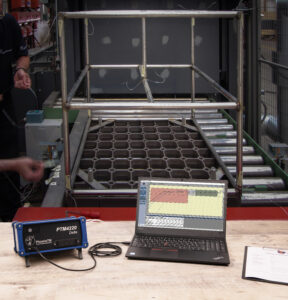
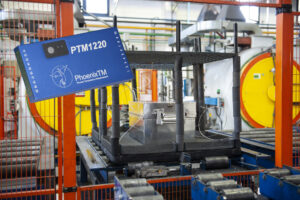
Figure 1. Typical TUS survey set-up for a static batch furnace. Twenty channel external data logger connected directly to a nine-point TUS frame used to measure the temperature uniformity over the volumetric working volume of the furnace.
Figure 2. Thru-process TUS monitoring system. The data logger shown is located inside the thermal barrier which travels with the TUS frame through the furnace.
Calibration Accuracy Requirements
In either method of operation, the measurement accuracy of the monitoring system is controlled by the combined accuracy of the field test instrument ‘data Logger’ and the temperature sensor ‘thermocouple’ used.
Working to AMS2750H the accuracy of the temperature measurement is strictly controlled. The field test instrument “data logger” needs to have a calibration accuracy of ±1.0 °F or ±0.1% of temperature reading, whichever is greater (Table 7) and as mentioned before have a readability of 0.1 °F. The most common Base metal thermocouples (K & N) used will themselves need to have a calibration accuracy ±2.0 °F or ±0.4%* as defined in Table 1 (*Percent of reading or correction factor °F, whichever is greater).
Field Measurement Accuracy
For process monitoring thermocouples are generally the most preferred temperature sensor on the basis of accuracy, robust operation, cost and availability. It is important though to fully understand the working limitations of the sensor technology from a working measurement accuracy perspective and ensure they are compensated for.
The theory of the thermocouple is traced back to a German Physisist Thomas Seebeck in 1821. The Seebeck effect discovered is when electricity is created between two dissimilar electrical conductors (metals). The voltage is defined by the actual temperature experienced. For a particular type of thermocouple the mV reading can be converted to a temperature using the Sebeck voltage curve referred to also as thermocouple look up tables.
The thermocouple using the Seebeck principle consists of two wires of dissimilar metals that are joined at the measurement point; referred to as the hot junction. The output from the sensor is a mV proportional to the temperature difference between the ‘hot junction’ and the connection point where the voltage is measured referred to as the ‘cold junction’. It is important to recognise that a thermocouple measures temperature difference not an absolute temperature.
The basic principle of how a thermocouple measurement circuit operates is shown below in a simple schematic (Figure 3).
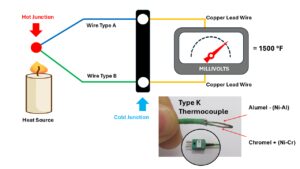
Figure 3: Basic thermocouple measurement circuit showing critical hot and cold junctions.
A common misconception, with regard accuracy, is that the accuracy of the thermocouple at the hot junction is the only important issue to consider. As previously mentioned the thermocouple measurement is reliant on the temperature reading at the hot junction offset against the temperature of the cold junction. From an electronics level the cold junction is where the thermocouple wires connect to the copper/copper connection on the electronic circuit. The cold junction therefore may be inside the data logger or if universal thermocouple connectors are used (Cu Sockets) on the outside of the data logger. To get a consistent accurate reading from the hot junction it is important to accurately monitor continuously the cold junction temperature so that this is corrected for using a method referred to as “Cold Junction Compensation”. It is critical that the cold junction temperature sensor is correctly located to ensure that the true cold junction temperature is measured and applied.
On paper the accuracy of many data loggers may appear to be acceptable but this may not reflect real world situations where the data logger temperature may not be stable affecting accuracy if accurate cold junction compensation is not implemented. The calibration accuracy in a stable temperature controlled laboratory, or performing an insitu calibration, is one thing but is the field test instrument able to work accurately on the production floor with significant swings in temperature over the survey period? Do you know what temperature changes the data logger may be experiencing on your process floor (Climatic variation during day / furnace heat up , loading and unloading actions)? Remember only a few degrees change in the cold junction temperature may compromise the measurement accuracy enough to fail the TUS level being tested if no compensation is undertaken or if the compensation temperature used does not accurately reflect the live cold junction temperature.
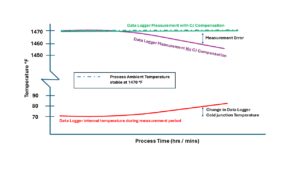
Figure 4: Effect of changing physical data logger temperature on the thermocouple measurement with and without cold junction compensation measuring a stable process temperature of 1470 °F.
Cold Junction Compensation Confidence
To maintain measurement accuracy in an industrial environment PhoenixTM data loggers have been designed with an essential accurate ‘Cold Junction Compensation’ technology. This allows the data logger accuracy to be quoted as +/- 0.5°F (Type K & N) over the full operating temperature range of the data Logger family. For standard data loggers used in conventional thermal barriers (phase change heat sink) the accuracy is maintained over the operating range 32 to 176 °F. For high temperature data loggers used in phased evaporation thermal barriers (water tank protection) the accuracy is provided over the operating range is 32 to 230 °F. As designed the data logger will operate at 212 °F (boiling water) so cold junction compensation is critical with the data logger ambient temperature changing from 70 to 212 °F during normal operation.
The PTM4220 external data logger (Figure 1) has an operating temperature range of 32 to 131 °F. On a production floor this allows safe operation with cold junction compensation addressing the effect of data logger cold junction temperature changing with environmental temperature fluctuations.
The thermocouple socket in the data Logger case is connected directly to the measurement board of the
data logger using thermocouple wire of the designated type (eg Type K). A thermistor temperature sensor monitors accurately the connector temperature (+/- 0.18 °F) providing an accurate record of the cold junction. The connector is located inside the data Logger cavity so protected from rapid environmental temperature changes, is compact and isothermal, so the thermistor temperature accurately reflects the cold junction of each unique thermocouple connection. This temperature therefore provides an accurate cold junction temperature compensation to maintain measurement accuracy with any internal data Logger temperature variation.
Thermocouple Accuracy
To maximize measurement accuracy it is important that thermocouples are selected with the highest accuracy and manufactured to resist damage from thermal cycling at elivated temperatures.
For ‘Thru-Process’ monitoring short thermocouple lengths are required to connect the data logger within the thermal barrier and the TUS frame. As such nonexpendable (AMS2750H 2.2.36, Table 3) thermocouples can be employed with ease. Robust mineral insulated thermocouples (MIMS) (Figure 5), typically type K or N, can be permanently fixed to the TUS frame. This both reduces set-up time and guarantees that thermocouple positions are consistent for periodic TUS work as defined (AMS2750H 3.1.7 Table 5).
Baring physical damage the MI thermocouples can be used unrestricted for up to 3 months (Type K) and 3 months (Type N) or longer if recalibration is successful, at 3 months anniversary.
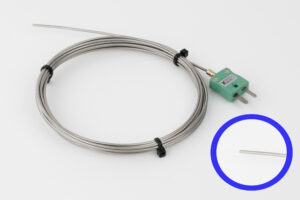
Figure 5. Nonexpendable mineral insulated thermocouple (MI) type K (0.06 inch) or N (0.08 inch). UHT alloy sheathed Insulated hot junction, terminating in miniature plug. Maximum temperature 2192°F ANSI MC96.1 Special Limits (±2.0 °F or ± 0.4%)* *which ever is highest.
Data Logger and Thermocouple Correction Factors
To maximize measurement accuracy the PhoenixTM system allows both data logger and thermocouple correction factors to be applied automatically to the raw survey temperature data. The data logger correction factors can be read directly from the onboard digital data logger calibration file. Thermocouples are available with comprehensive calibration certificates providing corrections factors at multiple set temperatures across the required measurement range. For both data logger and thermocouples, correction factors are interpolated across the complete calibration range using the linear method as permitted (AMS2750H 3.1.4.8) (Figure 6). This approach means that the accuracy of the entire Temperature Uniformity Survey (TUS) data set is guaranteed compared with applying a single correction factor calculated at a single nominated temperature which may not truly reflect the complete temperature range.
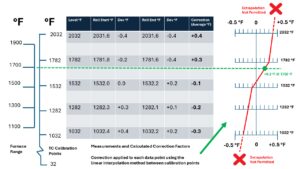
Figure 6: Schematic of the linear interpolation method (AMS2750 accepted) of calculating thermocouple correction factors over the entire calibration range of the thermocouple. Every TUS measurement is therefore corrected accurately against matching calibration offset data.
Summary
To guarantee the accuracy of both temperature profile and Temperature Uniformity Survey (TUS) data it is important that the Field Test Instrument ‘data logger’ not only provides the desired calibration accuracy but is able to work accurately in a production environment. For thermocouple systems accurate cold junction compensation is critical to correct for changes in the opertaing temperature characteristics of the data logger during use. To maximize measurement accuracy data logger and thermocouple correction factors should be implemented. As discussed the use of linear interpolation method ensures that correction factors calculated over the entire measurement range are implemeted providing full data accuracy.